A quadruple head, 1300 watt* server takes on workloads of 2022. How well does it fare?
Introduction:
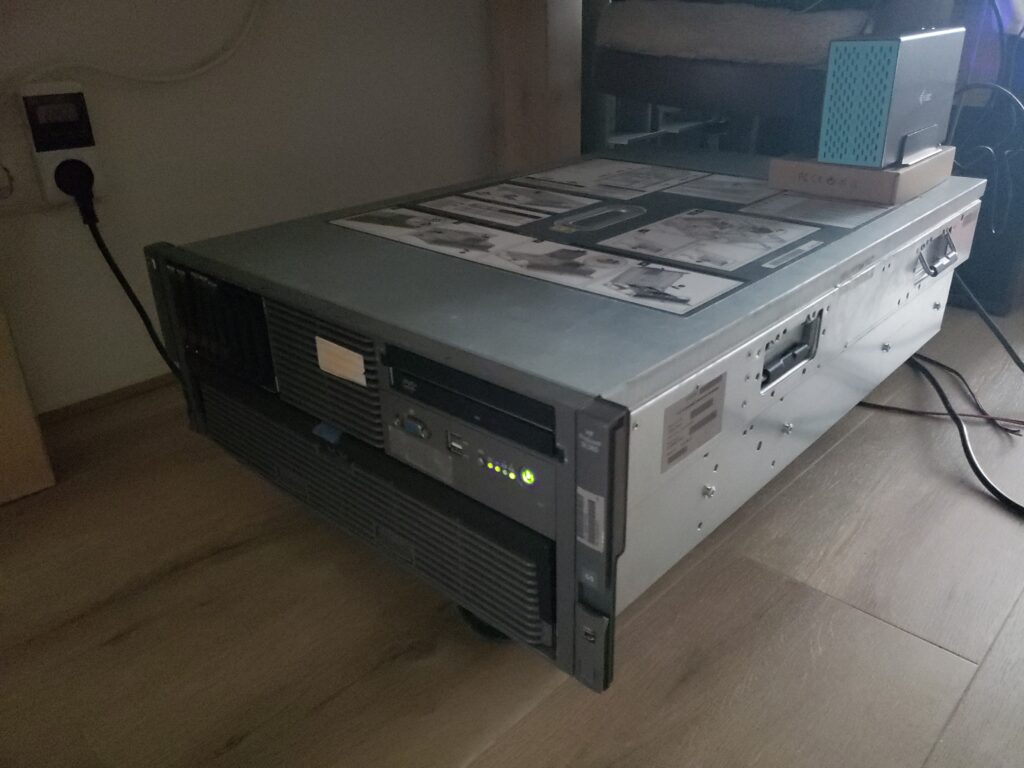
Imagine you buy a 35K+ dollar server machine with crazy hardware, in 2017 you put it on ebay as the damn thing eats so much electricity it costs a fortune just to keep running, it gets shipped, a bit damaged and 3 years later ends at another nerd’s home. Well, lets see what we can do with this.
Note:
Before you begin, I should set some expectations. And a couple other things.
This article has been in the works for MONTHS, since February or so. But due to life things I may not be able to put the same quality in it as my other posts. So, a couple things you should know as I’ve come to publish this.
- I was not able to get nicely done graphs made for this to showcase performance differences, and things and thus bound to get real technical.
- Since this article has been in the draft folder for so long, a change of attitude and language use is highly likely.
- I have also removed the ‘comparison’ paragraph, since I was not able to provide an easy-to-understand way to showcasing differences.
Regardless, this machine was a wonderful experience to work on and still is since I took it into operation a week or so ago 24/7. If anything were to happen or similar, I will update the article to showcase what it and me have achieved.
Now with that out of the way, enjoy the insanity that is this machine!
Specifications:
Now this is where things get funky. As mentioned, this system would have set you back a cool 35 thousand dollars back in 2008, and this unit was made around the 14th week of 2009.
In reality this is a data cruncher beast from the mid-2000’s using 4(!) descrete processors, and a total of 32 slots for RAM.
Yet what this exact unit used to do back in its hayday is unknown, and its pretty much as good as new other than the shipping damage from 2017. Oh well.
As for the hardware:
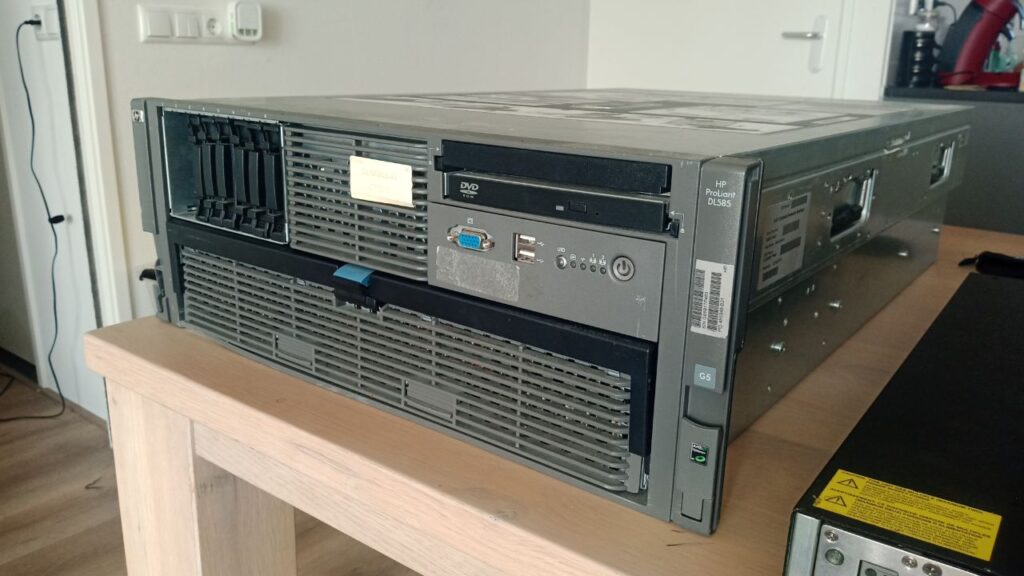
- Four Opteron processors, model 8378 at 2.4Ghz each with 6 megabytes of cache.
- 64 Gigabytes of DDR2 at 800MT/s speed. (See this wiki for more information)
- The storage controller is an HP P400 with extra cache memory and battery backup using the SAS 1.1 standard with 8 bays in total.
- Two 1300 watt power supplies for EXTRA POWAH.
And otherwise, not much! Two PCIe slot covers were replaced indicating it might have had two x16 cards installed, but who knows what it might have had in its life.
It weighs around 35 kilograms with a warning on the side that yes, when all modules are installed you really want to use two people to lift this unholy beast of a machine.
A little history:
But before we go any further; for those uninitated with datacenter hardware such as this HP machine, here is some information that might give you some insight in the why, how and where. After all, having a machine like this in your own home is absolute madness. My kind of madness.
Points of datacenter computers:
There are a couple points that are important when designing for and building a datacenter and its systems:
- Density
In a datacenter, you buy the whole space. Then the whole point of a datacenter is to manage that entire space and scam as dense as possible computing power as possible into it. - Power
And thus also comes the factor of how you would power so much hardware at the same time and reliably. Often there are UPS systems installed or a central backup power supply is installed outside the building such as a diesel generator or similar. - Heat
With so many computers close together comes massive heat outputs, so maneging heat output and getting it out of the building as effcient as possible is another big factor is designing and building a datacenter computer. Think of large air conditioning and huge ducts to get cold air in and warm air out of each facility. - Manageability
Since all the computers are going to be so close together, the best way to manage them all is remotely. Another way is via a KVM, a “Keyboard Video & Mouse” which will allow you to plug multiple computers into one set of keyboard mouse and screen. With the flip of a switch you can switch your screen to any system into the rack that may have issues.
But being physically in the datacenter between so much noise and heat is rather a last resort, instead a technology like IPMI is used, where you can access a special network where every server has essentially a small computer inside itself that manages everything. IPMI means Intelligent Platform Management Interface where the point is to remotely send control information or even enter keyboard commmands and look at the screen from somewhere else in the facility. - Redundancy
Another thing that enterprise servers and workstations all have is redundancy. Say a part of the hardware fails such as a power supply there are almost always at least 2 installed so that the other can take over and keep the system running as a new part will be alerted for replacement and installed.
Another form of redundancy is storage, for that you can look at RAID, meaning a “Redundant Array of Intependant Disks”
Video:
DerBauer, a professional overclocker from Germany did a great tour of one of these facilities:
So, where does this HP fit in?
The DL585 has two power supplies for redundancy, hardware accelerated RAIDfor redundant storage, extra dense computing power with loads of processing power at the cost of high power draw per unit.
Of course, an end user like me is never supposed to own a system like this. In the enterprise space, hardware is often upgraded or fully replaced for something modern every 4 or so years. This is also how I was able to get hardware to build the main server you are reading this on right now for a good price around 2 years ago now. That was hardware from 2015 being swapped out for something modern, as goes the upgrade cycle.
That said, lets see what hardware like this is still capable of.
Testing:
There are many ways to benchmark a system, but since the HP does not have a video card I will mainly focus on raw processing power.
OpenBenchmarking.org:
Other way to quickly and efficiently test multiple portions of a PC is the Phoronix Testing Suite.
So over around a day of testing various processor-related tests I have made a little test list one can use to compare against. You can find the full benchmark rundown here.
In my case, these tests should run for ~3 hours on an HP DL585 like mine. Of course, yours might be even faster, or you’re just interested in buying one, who knows!
One thing of note that it is often easier to just run the recommended command to see what Phoronix recommends for a system, but since it is possible for anything to come out of that with any configuration or system the list of tests I have included are on a barebone system, no graphics. All tested and known working. Except for one test, but thats not important.
phoronix-test-suite list-recommended-testsRunning the test list:
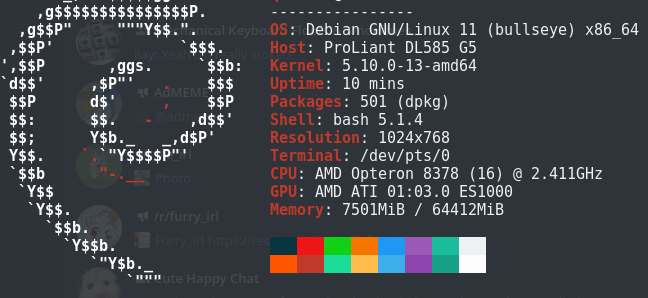
So before you begin, I used Debian 11 as my test system, and you can follow the steps to correctly compare and collect your results as follows;
- Install the Phoronix Test Suite on your system, you can do that here.
- Make sure you have “git” installed, it is needed to download some of the tests Phoronix uses.
- Now run “phoronix-test-suite batch-setup” and for my setup, enter the following answers:
Save test results when in batch mode (Y/n): y
Open the web browser automatically when in batch mode (y/N): n
Auto upload the results to OpenBenchmarking.org (Y/n): y
Prompt for test identifier (Y/n): n
Prompt for test description (Y/n): n
Prompt for saved results file-name (Y/n): n
Run all test options (Y/n): y
These should now be ready to run. To make sure you get no prompts it is recommended to first install all tests. Enter the following and follow intructions on screen.
phoronix-test-suite install pts/compress-7zip pts/openssl pts/encode-flac pts/compress-pbzip2 pts/gcrypt pts/mrbayes pts/hmmer pts/stream pts/nginx pts/stress-ngWhen complete, you can now use the batch-benchmark to let everything run automatically. The tests will say when it estimates completion time. As said before, in my case it was around 3 hours from start to finish.
phoronix-test-suite batch-benchmark pts/compress-7zip pts/openssl pts/encode-flac pts/compress-pbzip2 pts/gcrypt pts/mrbayes pts/hmmer pts/stream pts/nginx pts/stress-ngAnd that should be it! You can export my result as linked above to compare against your own result, on whatever system it may be.
FFMPEG:
What is FFMPEG?
FFMPEG, or “Fast Forward MPEG” is the most well known and well supported software solution for re-working or playing back pretty much any video or audio file in existance and can run on any real-world system one would want to use it on.
It allows for easy re-transcoding of video files, which is its most used goal. Transcoding is simply taking a file in one format, and converting it into another for say, YouTube use. Uploading a file from your camera directly to YouTube is possible, but will highly likely lead to quality loss and slow processing on YouTube itself.
By that I mean YouTube has to work to convert the video file to a format that can be used over the internet, but you have no control over the quality of the resulting file. This is why it can make sense to ‘pre-transcode’ your video to a YouTube format, for instance H.264 video so that you are much more in control of the resulting video.
So, what will we process?
Big Buck Bunny:
Now for continuity in testing all FFMPEG tests are done with the Blender “Big Buck Bunny” test files, which is a movie, completely rendered in Blender software back in 2008 and later remastered in higher resolutions.
You can get the files here officially, or look around for the video file to get a faster mirror for you country. In this case I went with “bbb_sunflower_2160p_60fps_normal.mp4” and “bbb_sunflower_1080p_30fps_normal.mp4” for testing as these will provide a well known and universal point of reference file.
For time testing/encoding benchmark of a real-world example (which you all can download too to do your own tests) I used the command below, with the recommended ffmpeg settings for transcoding to video streamers such as YouTube.
h.264:
time (ffmpeg -y -i "bbb_sunflower_2160p_60fps_normal.mp4" -c:v libx264 -preset faster -crf 18 -c:a aac -b:a 192k -pix_fmt yuv420p output.mp4)
vp9:
time (ffmpeg -y -i "bbb_sunflower_1080p_30fps_normal.mp4" -c:v libvpx-vp9 -af "channelmap=channel_layout=5.1" -quality realtime -speed 8 -tile-columns 4 -threads 8 -static-thresh 0 -row-mt 1 -qmin 4 -qmax 48 -b:v 4500k  output4.webm)
(Remember to change -threads to the amount of CPU cores/threads you have!
h.265:
time (ffmpeg -y -i "bbb_sunflower_2160p_60fps_normal.mp4" -c:v libx265 -preset faster -crf 18 -c:a aac -b:a 192k -pix_fmt yuv420p output.mp4)
AV1:
time (ffmpeg -y -i bbb_sunflower_1080p_30fps_normal.mp4 -c:v libaom-av1 -strict -2 -b:v 3000K -g 48 -keyint_min 48 -sc_threshold 0 -tile-columns 1 -tile-rows 0 -threads 8 -cpu-used 8 -pass 1 -f matroska output.mkv)
So, this does the following:
- Time the command.
- Open FFMPEG with the source file as -i (input)
- Set the video codec (-c:v) to h264 video, with slow preset for ‘best’ video quality, a constant rate factor of 18, which is around the sweetspot for compression to quality.
- Set the audio codec to AAC (Advanced Audio Codec).
- Then set the pixel format to YUV 4:2:0, (you can read about that here.)
- And lastly, the output filename.
Time taking is measured with the time command in Linux/Debian, where ‘real’ is the amount of time it took to finish the command, while ‘user‘ and ‘sys‘ time are how much CPU seconds that command uses in user and kernel mode. I included those stats as well, if you can use them is up to you. I certainly do not 😛
- Note, put the HP DL585 in “Static High Performace” mode for best results.
Also, while testing I found that the h.265 test was running at a mere 0.09X speed, so I wondered if maybe using a RAMdisk made the server lose performance. So, the HP has two tests each, one with RAMdisk, one using a normal SSD (Kingston SSDNow 200 90GB).
Mind you, these tests took literally 3 days to get right, and all tests were run 3 times for an average. Which resulted in the following:
| VideoTests | HL DL585; DDR2 555; RAMDISK | HL DL585; DDR2 555; No RAMDISK | Dual Xeon E5-2620 V3; DDR4 1866 | Ryzen 3100, DDR4 3200 |
| 2160P 60fps H.264 MP4 Test 1 | real 28m37.186s; user 410m0.342s; sys 1m59.320s | real 28m39.863s; user 409m55.838s; sys 2m4.218s | real 19m14.880s; user 298m6.542s; sys 1m42.408s | real 21m9.493s; user 153m8.020s; sys 1m3.866s |
| 2160P 60fps H.264 MP4 Test 2 | real 28m38.878s; user 409m20.128s; sys 2m2.128s | real 28m42.995s; user 409m27.582s; sys 2m0.084s | real 19m9.214s; user 297m2.706s; sys 1m43.624s | real 21m0.689s; user 153m10.313s; sys 1m3.927s |
| 2160P 60fps H.264 MP4 Test 3 | real 28m45.258s; user 411m16.530s; sys 1m58.685s | real 28m38.202s; user 409m27.597s; sys 2m2.231s | real 19m6.692s; user 297m54.161s; sys 1m43.885s | real 21m1.262s; user 152m54.063s; sys 1m3.928s |
| 1080P 30fps H.264 MP4 Test 1 | real 4m25.709s; user 55m32.109s; sys 0m33.770s | real 4m27.182s; user 55m42.595s; sys 0m33.848s | real 2m53.774s; user 40m29.071s; sys 0m26.889s | real 3m7.811s; user 21m50.182s; sys 0m10.658s |
| 1080P 30fps H.264 MP4 Test 2 | real 4m25.835s; user 55m35.924s; sys 0m32.521s | real 4m26.300s; user 55m26.358s; sys 0m34.854s | real 2m56.031s; user 40m42.447s; sys 0m26.982s | real 3m7.516s; user 21m51.376s; sys 0m11.175s |
| 1080P 30fps H.264 MP4 Test 3 | real 4m25.509s; user 55m35.463s; sys 0m32.400s | real 4m26.720s; user 55m35.013s; sys 0m33.781s | real 2m57.192s; user 40m50.846s; sys 0m28.705s | real 3m6.940s; user 21m54.754s; sys 0m11.760s |
| 2160P 60fps H.265 MP4 Test 1 | real 141m23.265s; user 2005m33.315s; sys 2m8.478s | real 141m52.463s; user 2014m42.264s, sys 2m16.768s | real 34m15.505s; user 516m57.878s; sys 2m26.623s | real 40m46.833s; user 276m53.114s; sys 1m29.355s |
| 2160P 60fps H.265 MP4 Test 2 | real 141m26.976s; user 2006m28.327s; sys 2m11.730s | real 142m3.744s; user 2015m47.543s; sys 2m18.101s | real 34m16.212s; user 516m14.703s; sys 2m27.858s | real 40m36.432s; user 275m55.459s; sys 1m39.753s |
| 2160P 60fps H.265 MP4 Test 3 | No | No | No | No |
| 1080P 30fps H.265 MP4 Test 1 | real 27m17.507s; user 312m55.158s; sys 0m41.907s | real 27m17.403s; user 312m54.980s; sys 0m42.223s | real 7m25.793s; user 81m58.056s; sys 0m31.053s | real 7m1.286s; user 46m40.237s; sys 0m18.606s |
| 1080P 30fps H.265 MP4 Test 2 | real 27m17.880s; user 312m55.303s; sys 0m42.276s | real 27m18.494s; user 312m58.111s; sys 0m42.558s | real 7m26.237s; user 81m56.893s; sys 0m30.982s | real 6m58.130s; user 46m56.138s; sys 0m16.506s |
| 1080P 30fps H.265 MP4 Test 3 | real 27m17.428s; user 312m59.108s; sys 0m41.808s | real 27m17.774s; user 312m57.472s; sys 0m41.339s | real 7m28.193s; user 82m5.700s; sys 0m30.823s | real 7m3.996s; user 46m57.477s; sys 0m17.735s |
| 2160P 60fps VP9 WEBM Test 1 | real 27m44.545s; user 204m0.540s; sys 2m21.199s | real 27m48.858s; user 203m32.913s; sys 2m20.063s | real 20m1.450s; user 166m19.085s; sys 2m53.836s | real 13m4.263s; user 68m16.353s; sys 0m45.031s |
| 2160P 60fps VP9 WEBM Test 2 | real 27m29.585s; user 202m17.826s; sys 2m21.426s | real 27m41.678s; user 203m56.857s; sys 2m19.939s | real 20m16.991s; user 167m4.259s; sys 3m1.016s | real 12m31.101s; user 68m19.037s; sys 0m44.317s |
| 2160P 60fps VP9 WEBM Test 3 | real 27m38.618s; user 202m3.887s; sys 2m21.093s | real 27m51.149s; user 204m31.255s; sys 2m21.097s | real 20m27.451s, user 168m29.235s; sys 3m1.052s | real 12m35.693s; user 68m5.377s; sys 0m43.733s |
| 1080P 30fps VP9 WEBM Test 1 | real 6m37.339s; user 35m5.293s; sys 0m38.287s | real 6m40.012s; user 35m23.413s; sys 0m39.757s | real 5m37.474s; user 35m30.299s; sys 0m38.465s | real 2m59.100s; user 12m51.317s; sys 0m10.904s |
| 1080P 30fps VP9 WEBM Test 2 | real 6m35.696s; user 35m11.873s; sys 0m38.722s | real 6m39.697s; user 35m21.398s; sys 0m40.314s | real 5m35.326s; user 35m15.781s; sys 0m39.382s | real 2m58.669s; user 12m51.418s; sys 0m11.266s |
| 1080P 30fps VP9 WEBM Test 3 | real 6m37.308s; user 35m11.078s; sys 0m38.546s | real 6m37.935s; user 35m17.001s; sys 0m39.234s | real 5m39.799s; user 35m25.250s; sys 0m40.014s | real 2m59.219s; user 12m54.329s; sys 0m10.526s |
| 1080P 30fps AV1 MP4 Test 1 | real 80m28.809s; user 84m58.380s; sys 0m4.168s | real 80m33.867s; user 85m1.717s; sys 0m3.368s | real 31m13.594s; user 36m15.090s; sys 0m2.460s | real 21m29.843s; user 23m49.490s; sys 0m3.884s |
| 1080P 30fps AV1 MP4 Test 2 | real 80m38.466s; user 85m5.883s; sys 0m3.304s | real 81m8.681s; user 85m36.684s; sys 0m3.581s | real 32m7.115s; user 36m21.990s; sys 0m3.432s | real 21m22.912s; user 23m45.989s; sys 0m5.340s |
Using these, primairly the “real” measurement you can get a rough indication on how much faster one system is compared to another. (As long as you use the exact same methodology of course.)
Conclusions of transcoding tests:
In the most-used formats, the Opteron does pretty decently, but the moment you ramp up the framerate or resolution it absolutely craps itself.
141 minutes for a transcode, you might as well watch the move live while it works things out using software like Plex. Would have you a cool 2 hours in the process!
Like in other workloads, the Xeon system stays behind as well, as the more modern Ryzen system chugs on happily. Not to mention the power draw:
The Opteron eats around 650 watts, the Xeon around 160, and the Ryzen only 40 to 65 while working!
FFMPEG notes:
- Tests were done using a RAM Disk to elimitate SSD bottlenecks and give both systems as much data as fast as possible.
You can do the same using a command like: sudo mount -t tmpfs -o size=8g tmpfs /mnt/tmp
This will make a RAM Disk of 8 Gigabytes in /mnt/tmp. (You might need to make the folder /mnt/tmp yourself or choose a difference folder.) - Look at this page in case you get an “invalid channel layout 5.1(side)” error.
- AV1’s transcoding settings were aquired here because at stock settings the transcode would have taken 70+ hours on the PC’s.
Compilation:
Linux users will often have to compile software, so another processing test is compilation speed.
Compilation is this case meaning to build a pre-packaged executable or installation package for a piece of software.
Spigot:
Spigot is a more-optimized variant of the Minecraft Server software, combining Bukkit (A platform for adding modules to Minecraft servers, aka “plugins”) and Spigot-oriented optimizations.
In this case, I will be compiling version 1.18.2, using OpenJDK-17-JDK.
The BuildTools compiler is run from a clean folder, so to keep the download times at the same speed I will be comparing my 4 core Ryzen 3100 PC against this HP DL585.
This will thus test multiprocessing speed, compilation speed, access times for many small files and download speed.
Additional versioning information if needed:
Found version
{
        "name": "3485",
        "description": "Jenkins build 3485",
        "refs": {
                "BuildData": "641cb0c939c7c2a3c4b42f2fd7bca7c8b34254ae",
                "Bukkit": "312281eade984b060ae27c84b63f48cafbb76fd8",
                "CraftBukkit": "2ac7fa7af6c1e1ddb0a61d7761eb66eda96f8207",
                "Spigot": "b6d12d17cd1763d488a42cb9f3e6c424de5f12a8"
        },
        "toolsVersion": 138,
        "javaVersions": [61, 62]
}
Commands used for these tests:
# Download BuildTools version 147
wget https://hub.spigotmc.org/jenkins/job/BuildTools/147/artifact/target/BuildTools.jar
# For Minecraft 1.18.2.
java -jar BuildTools.jar --rev 3485
# For Minecraft 1.15.2
java -jar BuildTools.jar --rev 2703
# For Minecraft 1.13.2
java -jar BuildTools.jar --rev 2148
Results:
| Spigot 1.18.2 | HL DL585; DDR2 555; SSD | Ryzen 3100, DDR4 3200, SSD |
| BuildTools 1.18.2 Test 1 | 00:59.50 | 00:26.57 |
| BuildTools 1.18.2 Test 2 | 00:59.57 | 00:26.52 |
| BuildTools 1.18.2 Test 3 | 00:59.87 | 00:27.70 |
| BuildTools 1.15.2 Test 1 | 00:46.54 | 00:21.10 |
| BuildTools 1.15.2 Test 2 | 00:45.76 | 00:17.38 |
| BuildTools 1.15.2 Test 3 | 00:43.79 | 00:16.73 |
| BuildTools 1.13.2 Test 1 | 00:42.15 | 00:17.12 |
| BuildTools 1.13.2 Test 2 | 00:41.25 | 00:17.12 |
| BuildTools 1.13.2 Test 3 | 00:40.66 | 00:16.87 |
| Average Time | 00:48.79 | 00:20.79 |
Linux Kernel:
Another compilation test that is very important to linux developers and power users is the compilation time of the kernel.
Maintainers or power users that might want to tweak their kernel will want a system they can test their work the fastest on, so a fast but stable compile is critical to getting the most development and testing time out of a day.
For this, we will return to the Phoronix Test Suite, since it has a test especially for this. A test run of all options and discussed before will around around an hour or so.
- Note: You might need to install “libelf-dev” package when the error “elf.h:10:10: fatal error: gelf.h: No such file or directory” appears.
phoronix-test-suite install pts/build-linux-kernel
phoronix-test-suite batch-benchmark pts/build-linux-kernel
Results:
- Opteron:
https://openbenchmarking.org/result/2205114-NE-20220511135 - Ryzen:
https://openbenchmarking.org/result/2205118-NE-20220511205
The Opteron finished compiling in 170 seconds, and the Ryzen in 162 seconds. That is only a 4.81% difference! Very respetable for its age. Remember, this HP is 12 years older than the Ryzen chip!
Rendering:
Now there are various ways to tackle rendering, so I will give a couple demonstrations using different software solutions.
CineBench:
CineBench is a benchmark for CINEMA 4D by Maxon, a very well known benchmark for testing general rendering speed.
Each CineBench version is loaded with a demonstration ‘scene’ which contains the raw data, CineBench then adds the photo effects and reflections on the base data, creating a fully rendered scene or image. These tests have been updated for many years as technology improves, CineBench is also known to make heavy use of AVX instructions available, also making CineBench a good stress test for newly built computers.
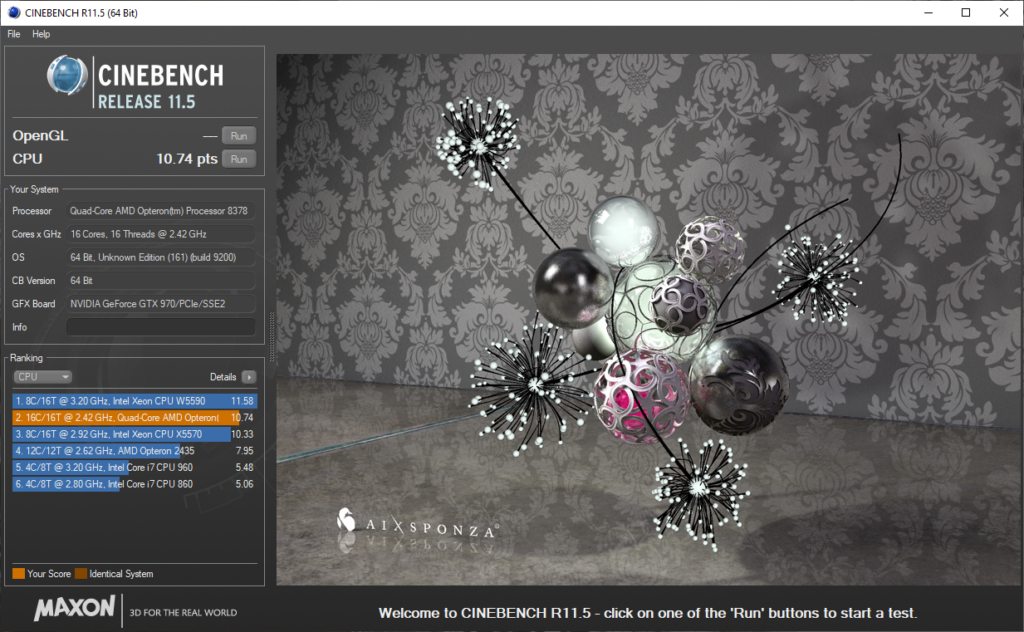
Cinebench R11.5:
Cinebench R11.5 (Stylized cineBENCH Release 11.5) is from around 2009, the same date this HP has built.
Here you can see how it compares to some processors of that time.
Another thing I noticed later is that later updates of Windows 10 hurt performance, the ISO I used with a date of 10-06-2021 produced a score of 10.90 but a fully up to date system as of 17-07-2022 produced 10.74.
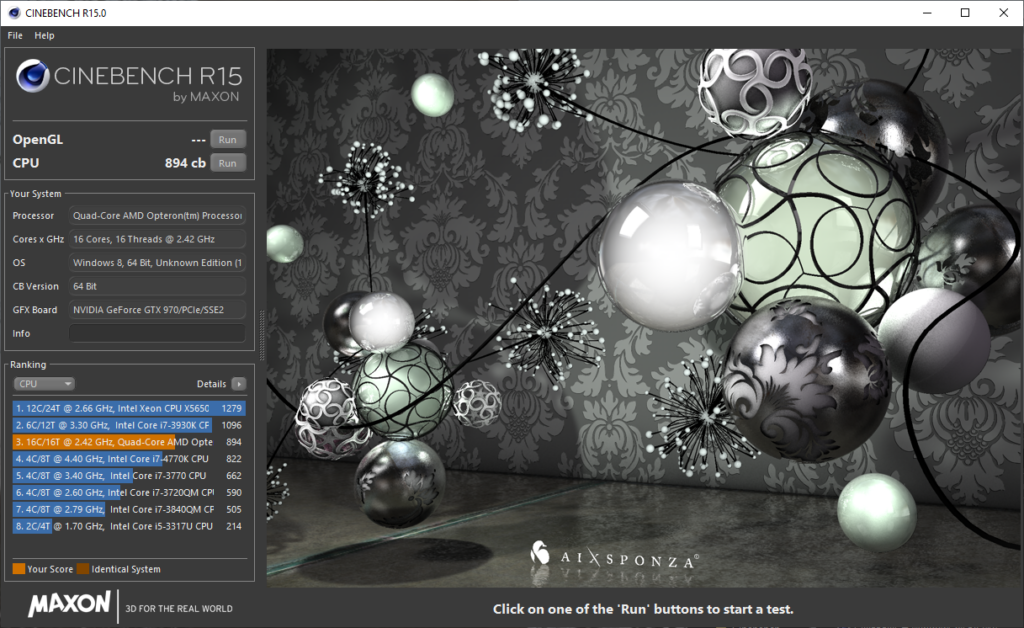
Cinebench R15:
Cinebench R15 is probably the most well known, used for MANY years in leaderboards and the like, even today.
Later on even modded versions that used a way more intensive render file, “Cinebench R15 Extreme Edition” were made, and probably many more like it.
R15 Scores between 894 and 914 or so on this system.
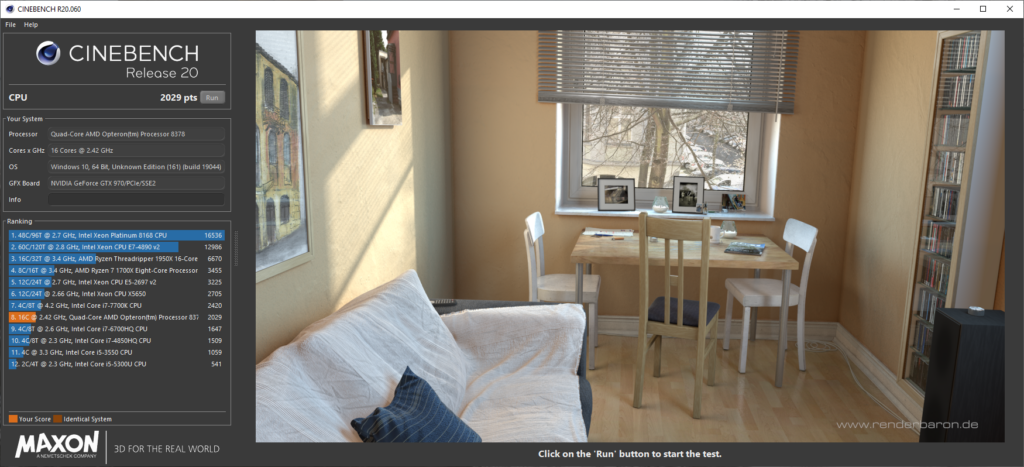
Cinebench R20:
Cinebench R20 added support for up to 256 processor threads, and a new rendering engine.
Heavier workloads and better processor scaling support futureproofed R20 more, as the industry grows more to many-core processors.
Here Cinebench R20 scores 2020 to 2030 accurately
Cinebench R23:
Cinebench R23 further changes to the industry.
Now running for 10 minutes continiously due to processors now having a higher speed for a limited time before slowing down afterwards.
In my case, the HP does not have this “slowing down” technology, often called Intel SpeedStep or AMD Cool’n’Quiet.
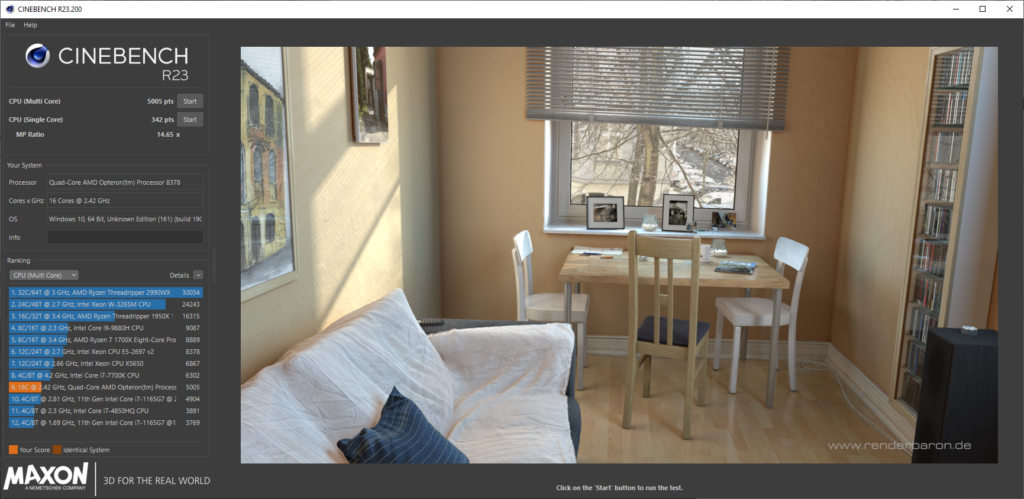

The results you see here are interesting in themselves.
You can see that the single-core, so single-processor speed is quite low, and the multi-processor result is nowadays ‘equivalent’ to a laptop processor.
Basically the saying of throwing more power at a problem rather than improving the basics.
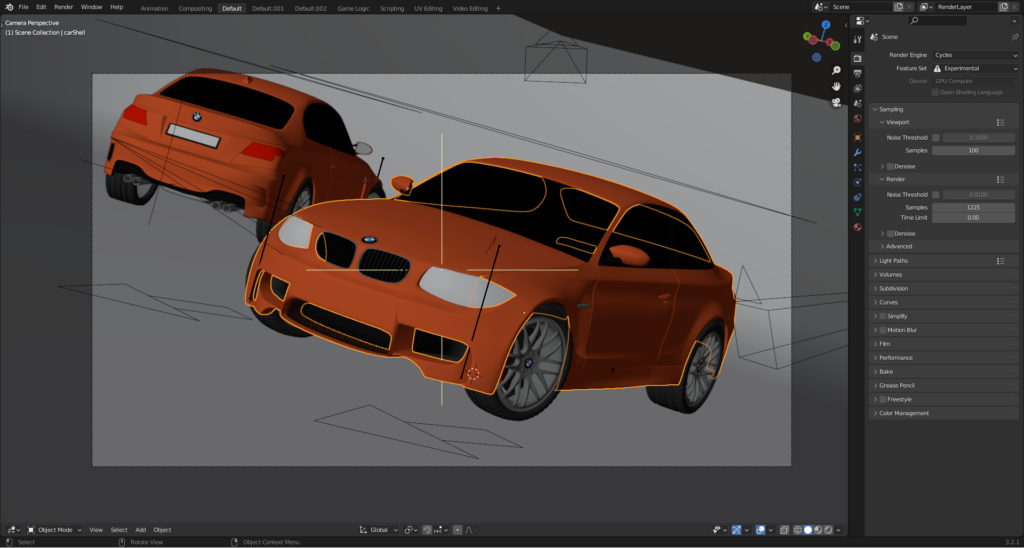
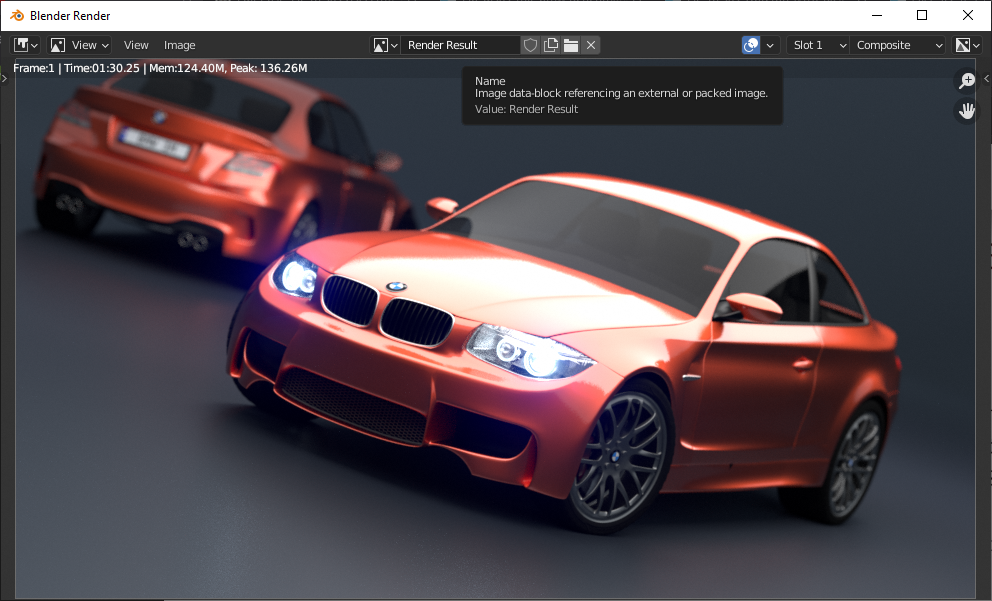
Blender:
Blender is an open source renderer, 3D Modeling tool and much, much more.
It is also one of the tests that are run to indicate overall system performance for rendering workloads for many work cases, and it can use my different setups of hardware to get the best results. For back in 2009, this quad socket system would have been an absolute beast at rendering workloads because remember, time is money!
I did the testing in two ways, one on Linux and one on Windows 10. (Pro for workstations).
This made me realize that Windows, unless a power virus is active such as OCCT actually eats 100 overall watts less than Linux does, why this is is unsure, but going by the rule that wattage is utilization; Then we can find this:
https://openbenchmarking.org/result/2205286-NE-2205124NE47
(PFWS: Pro For Workstations)
In this test you can make out that with the usual Linux power draw of 330 watts, and the Windows power draw of around 230 watts, and with a measured performance difference of 22 to 30 perfect, it might make sense to assume that Windows’ ability for NUMA nodes might be quite unoptimized.
HP Combined/Independent memory mode.
This is a feature in the BIOS of the G5 server, where you can tell the memory controller to become “Ganged”, so Combined or “Unganged”, independant.
This changes the memory transfers to a single 128 bit wide bus, so “ganged”, or to multiple 64 bit wide buses, “unganged”.
I found these options now 2 weeks into testing, but the difference is barely there. Barely measurable even.
Supposedly this is supposed to help with multithreaded applications by allowing easier mapping and access of memory space. But from what I can see, in both some transcodes and on AIDA64 6.70.6000 the difference is pretty much down to margin of error. You for expample can look here for a forum discussion about the matter.
AIDA64:
| Ganged (Combined Channel Mode) | Test 1 | Test 2 | Average | Measurement |
| Memory Read: | 23746 | 23807 | 23776.5 | MB/s |
| Memory Write: | 24106 | 24042 | 24074 | MB/s |
| Memory Copy: | 23449 | 23441 | 23445 | MB/s |
| Memory Latency: | 119.6 | 120.1 | 119.85 | ns |
| CPU Queen: | 54483 | 54391 | 54437 | Score |
| CPU PhotoWorxx: | 17521 | 17525 | 17523 | Mpixels/s |
| CPU ZLib: | 488 | 486.8 | 487.4 | MB/s |
| CPU AES: | 2583 | 2585 | 2584 | MB/s |
| CPU SHA3: | 1759 | 1760 | 1759.5 | MB/s |
| FPU Julia: | 24496 | 24510 | 24503 | Score |
| FPU Mandel: | 12466 | 12473 | 12469.5 | Score |
| FPU SinJulia: | 6224 | 6229 | 6226.5 | Score |
| FPU32 Ray-Trace: | 3834 | 3834 | 3834 | Krays/s |
| FPU64 Ray-Trace: | 2088 | 2086 | 2087 | Krays/s |
| Unganged (Independent Channel Mode) | Test 1 | Test 2 | Average | Measurement |
| Memory Read: | 23639 | 23735 | 23687 | MB/s |
| Memory Write: | 24252 | 24321 | 24286.5 | MB/s |
| Memory Copy: | 23563 | 23653 | 23608 | MB/s |
| Memory Latency: | 119.3 | 120.2 | 119.75 | ns |
| CPU Queen: | 54386 | 54496 | 54441 | Score |
| CPU PhotoWorxx: | 17586 | 17580 | 17583 | Mpixels/s |
| CPU ZLib: | 487.6 | 488.4 | 488 | MB/s |
| CPU AES: | 2584 | 2582 | 2583 | MB/s |
| CPU SHA3: | 1759 | 1759 | 1759 | MB/s |
| FPU Julia: | 24510 | 24494 | 24502 | Score |
| FPU Mandel: | 12478 | 12476 | 12477 | Score |
| FPU SinJulia: | 6228 | 6224 | 6226 | Score |
| FPU32 Ray-Trace: | 3834 | 3834 | 3834 | Krays/s |
| FPU64 Ray-Trace: | 2088 | 2086 | 2087 | Krays/s |
| Ganged (Combined) | 197326.25 | |||
| Unganged (Combined) | 197681.25 | |||
| Difference | 0.000505% | |||
| Max Ganged | 54437 | |||
| Max UnGanged | 54441 | |||
| Difference | 0.001837% | |||
| Min Ganged | 119.85 | |||
| Min UnGanged | 119.75 | |||
| Difference | 0.83% |
Transcoding:
A real-world example to test is to transcode video into a different format.
| Ganged/Unganged Testing | HL DL585; Ganged (Combined mode) | HL DL585; Unganged (Independent mode) |
| 1080P 30fps H.264 MP4 Test 1 | real 4m30.998s; user 55m46.717s; sys 0m35.089s | real 4m31.091s; user 55m42.968s; sys 0m36.507s |
| 1080P 30fps H.264 MP4 Test 2 | real 4m30.887s; user 55m49.643s; sys 0m34.543s | real 4m29.248s; user 55m37.291s; sys 0m35.691s |
| 1080P 30fps H.265 MP4 Test 1 | real 27m16.805s; user 312m45.214s; sys 0m44.088s | real 27m17.705s; user 313m24.070s; sys 0m45.716s |
| 1080P 30fps H.265 MP4 Test 2 | real 27m19.170s; user 313m27.527s; sys 0m45.886s | |
| 1080P 30fps VP9 WEBM Test 1 | real 6m45.913s; user 35m59.731s; sys 0m41.002s | real 6m43.884s; user 35m44.508s; sys 0m38.945s |
| 1080P 30fps VP9 WEBM Test 2 | real 6m45.002s; user 35m46.407s; sys 0m39.708s | real 6m44.721s; user 35m44.772s; sys 0m39.206s |
| 1080P 30fps AV1 MP4 Test 1 | real 80m25.027s; user 84m56.250s; sys 0m3.644s | real 80m34.771s; user 85m4.812s; sys 0m4.024s |
But here the difference is marginal, and this counts for almost every workload.
You can try to see if there is a difference, but its all within the margin for error on my part.
Gaming:
I tested a couple video cards, and used a GTX 970 for play testing. No detailed benchmarks will be added to this article as of now, but I might do later in an extra article talking about the matter once I know how. Gaming on an architecture like this is much more complicated than it would seem on the surface, so maybe!
So here is a list of games I was able to test out. (Links go to Steam page of mentioned game.)
Works:
- F1 2015:
Sadly no longer for sale. - F1 2019
Sadly no longer for sale. - Distance:
- Tomb Raider 2013:
- Shadow of the Tomb Raider:
- DOOM 2016 (Vulkan):
Runs GREAT: 90 to 150fps in-game at 1080P Ultra settings. - Forza Horizon 4:
- Goat Simulator:
- DiRT 5:
Plays well, VRAM limited on GTX 970. - Need For Speed; Most Wanted 2012:
Works, no real benchmark mode. - Need For Speed 2016:
30 to 40FPS 1440P default settings but stutters a bit. - Age Of Empires 2 DE:
13fps in Benchmark, will only allow 1v1 multiplayer because of it. - Gears Tactics:
94% GPU Bound says the benchmark, the processors are doing their best. - HITMAN 3:
Cannot use more than 1 socket due to no NUMA support.
32.5FPS on Dubai test. - GRiD Autosport:
56FPS @ 1440P High 4X-MSAA
Not for sale anymore. - GRiD 2:
59FPS 1440P High 4X-MSAA
Not for sale anymore. - Bioshock The Collection (Epic link + benchmarking Tool is broken on Epic Games Launcher)
Working + easy Benchmarks.
- F1 2015
- F1 2019
- Tomb Raider 2013
- Tomb Raider 2019
- Forza Horizon 4
- DiRT 5: Plays well, VRAM limited on GTX 970.
- Age Of Empires 2 DE
- Gears Tactics
- HITMAN 3
- GRiD Autosport
- GRiD 2
Does not work:
- Forza Horizon 5:
Does not open. - DiRT Rally:
Tries to launch; crashes. - DiRT 4:
Does not open, CPU error. - DOOM Eternal:
Error 0x8007042B - NFS Heat:
Does not open.
Conclusion:
This was a months-long project that ultimately got completely out of hand but was still loads of fun.
In these months I wrote all of this, it never failed to start and could even game pretty well with something like an HD 5750 added to the system.
Now it is December, and the system has been taking into operation by me for offsite backup, network storage and web hosting purposes. With its high power draw this might not always make sense to do, but in my case it will work just fine.
If you find one, or happen to know someone who did like in my case, you could certainly have a lot of crazy shenanigans on an overkill system like this. Making computers do things they were never designed to do will always remain funny to me. 😛
I hope you enjoyed looking at this machine’s insanity as much as I did, and if you made this this far, thank you for reading!
Other notes I found along the way:
- SFTP transfers are single threaded and are bottlenecked at roughly 51MiB/sec per transfer on these 8378 processors.
Using FileZilla to start another simultaneous transfer will help. - The system eats around 400 to 550 watts under load (Divide by two for per-powersupply usage)
- Using “Dynamic Power Saving” does indeed save ~170 watts of power but also cuts your performance in half in some workloads, “Static High Performance” makes things MUCH faster when you have it enabled at the cost of the system eating ~570 watts in a workload like H264 encoding, rather than 400 watts or so. So before comparing, PLEASE turn on high performance mode in the BIOS. It took me 2 days to figure out why the scores were fluctuating so much.
Your performance will go from 14 minutes and 19 seconds to transcode “bbb_sunflower_1080p_30fps_normal.mp4” to just 7 minutes 1 second for the same transcode. Also, if you want best of both worlds you should use “OS Control” mode, but this might influcence the scoring. - Using xRDP on Linux will affect performance, moving a window around eats an entire CPU core just to render it with llvmpipe. Recommending to use VNC instead. For Debian, I got this how to to work perfectly.
- Using the included P400 SAS controller you can expect some problems if you connecting is flaky because you had, or me in this case did not install/buy any caddies to hold the disks in place. This ultimately resulted in a failing RAID 0 array.
- It is also HIGHLY recommended to go for SSD’s in an array or as independant disks as normal SATA disks perform horribly on this system. An SSD, even a single one greatly improves system performance/snappiness.